A New Golden Age

Golden Years: 2017–2019
01/02/17 – Gold & Silver fulfilled the second phase of expectations for 2016 – a sharp drop into late-2016 following an initial surge into mid-2016. That action represents the ‘1’ & ‘2’ wave of what is expected to be a multi-year advance, linked to weekly, monthly, yearly & multi-decade cycles.
On an annual basis, the months of Nov. & Dec. have timed each of the past 3 – and 4 of the last 5 – lows. That created a ~360-degree low-low-low-low Cycle Progression targeting late-2016 for a bottom.
Even before Gold & Silver embarked on their initial ~6-month surges, Dec. 2016 was the focus for a secondary low, discussed since late-2015.
In between, Gold & Silver set intervening peaks in early-Nov. 2016 – the latest phase of a ~4-month high-high cycle, linked to highs in early-March & early-July 2016.
That 4-month cycle has been discussed since 2014 and has been uncanny in timing an ongoing Cycle Progression. The next phase is in March ‘17 – when another high could be seen.
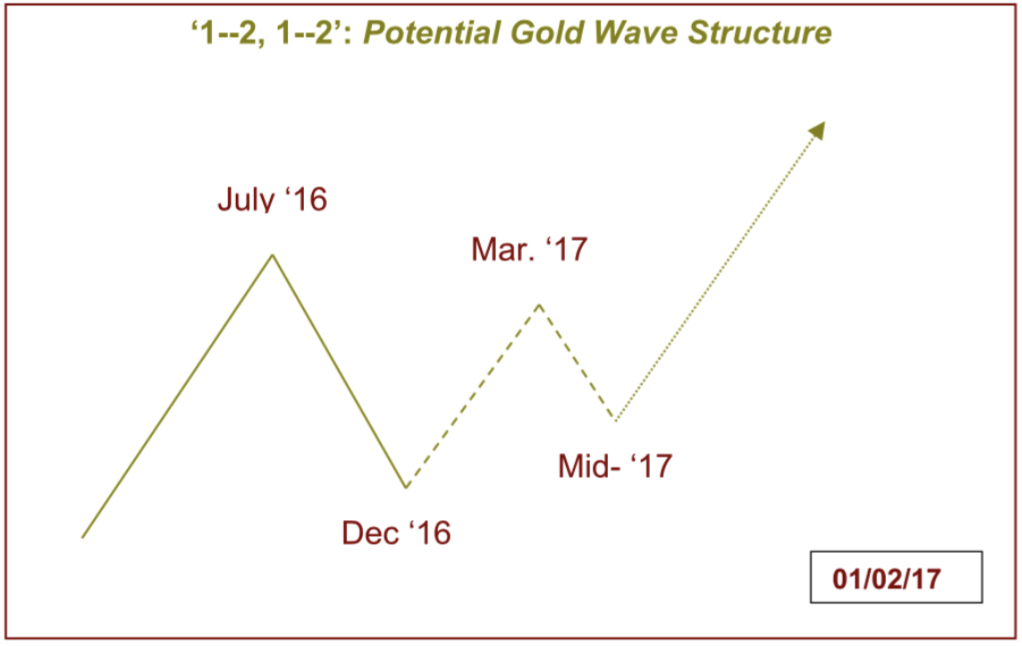
From an overall wave standpoint, Gold & Silver could soon enter a ‘1’ & ‘2’ wave on a lower level (one degree lower). So, if the primary wave surged for ~7 months and then retraced for ~5 months… this secondary wave could rally for 3–4 months and then retrace for ~2 months.
In Elliott Wave terminology, that would be a ‘1-2, 1-2’… or more accurately, a ‘I-II, 1-2’ and set the stage for the onset of a ‘3’ of ‘III’ wave advance – beginning in 3Q 2017.
The accompanying diagram is just a rough estimate of that wave structure & timing. Market action in January should begin to hone this outlook and fill in more specific expectations…

The XAU fulfilled projections for a final pullback low in Dec. 2016 – the latest phase of an ~11-month low-low cycle & a .618 retracement in time (29 weeks up/18 weeks down). The 6-week Cycle Progression corroborated that and helped time the intra-month low.
It would take a weekly close above 92.50/XAU to confirm a 1–3 month (minimum) bottom and diminish the potential for a subsequent low in mid-Jan. (1-year/360-degree high (Jan. ’15)–low (Jan. ’16)–low (Jan. ’17) Cycle Progression).
Platinum fulfilled analysis for an overall decline (since August) into Dec. 2016. It tested key support at ~897.0/PL (Jan. ‘16 high) and has begun to rebound. It would, however, take a weekly close above 960.0/PLJ to show any signs of bottoming.
Copper has consolidated with a new advance expected in Jan.–March 2017. After setting a double top, Copper retraced to its ‘4th wave of lesser degree’ support (the low immediately before the final rally) at 2.4350/HGH. That should spur a rally to new highs in 1Q 2017.
On a 3–6 month basis, Copper remains well above the multi-month lows set in late-October – when a 20–21 week low-low-low-(low) Cycle Progression projected a multi-month bottom. March 2017 is the next phase of that 20–21 week cycle and could produce a significant peak.
This action is powerfully validating expectations for Copper to lead inflationary commodities higher in 2017–2018 as a major shift unfolds. IT
The stage is being set for 2018–2019, a potentially explosive time for Gold & Silver. In recent years, INSIIDE Track has described the outlook for gold that included:
— Multi-year top in 2011, followed by drop into 2015.
— Multi-year low in late-2015, followed by surge into mid-2016.
— Multi-month high in mid-2016, followed by drop into Nov./Dec. 2016.
And now…
— 3–4 month rally into March/April 2017 followed by 2–3 month drop into June/July 2017.
— A more convincing uptrend to begin to emerge in 3Q/4Q 2017.
Refer to INSIIDE Track & Weekly Re-Lay for more detailed analysis and trading strategies.