Stocks Fulfilling 40-Year Cycle
01/04/22 INSIIDE Track – Cycle Culminations: “2021/2022 ushers in a new cycle, with the opening years often the most dramatic (transitions are always the roughest period before a new, or revised, ‘norm’ begins to take hold). One need only look at the early 1820’s, 1860’s, 1900’s, 1940’s & 1980’s to verify this pattern…
2022 has the potential for some intriguing parallels and also some stark contrasts to that pattern. Part of that has to do with the principles governing cycle analysis and Hadik’s Cycle Progression…
40-Year Low-Low Cycles
In the first half of the USA’s history (roughly from 1780 – 1900), the movement of Gold swung similar to that of the economy. Stable and dependable Gold usually coincided with a stable and dependable economy (more or less). Conversely, panics in Gold (like 1869) led to panics in stocks.
Since ~1900, the correlation has been inconsistent. However, 2016 – 2021 was similar with both moving higher throughout that time frame and both suffering sharp setbacks in March ’20. In order to better understand what is expected for the coming years, it is important to review a related 40-Year Cycle that has timed pivotal lows in the US economy…
1782 – Start of new country (and financial system) after end of Revolutionary War (Treaty of Paris drafted on Nov 30, 1782; peace negotiations began in April 1782); first American commercial bank is opened and a new monetary system begins to take hold after the collapse of the Continentals (paper currency).
The chart above [see original publication] provides a broad illustration of the economic growth in America in 1700 – 1850 with the two intervening low points spread exactly 40 years apart (surprised?) – in ~1782 and ~1822.
1822 – Follows Panic of 1819 and recession of 1819 – 1821, one of the worst in US history. It included mass unemployment and plunging property values that bottomed in 1822. However, there were far-reaching ramifications of that Panic, particularly the heightened skepticism of paper money that it raised among the American public. That is why Gold’s movement synced with the economy. To quote:
“The national bank’s reaction to the crisis—a clumsy expansion, then a sharp contraction of credit—indicated its weakness, not its strength. The effects were catastrophic, resulting in a protracted recession with mass unemployment and a sharp drop in property values that persisted until 1822.
The financial crisis raised doubts among the American public as to the efficacy of paper money, and in whose interests a national system of finance operated. Upon this widespread disaffection the anti-bank Jacksonian Democrats would mobilize opposition to the BUS in the 1830s. The national bank was in general disrepute among most Americans..” (wikipedia.org/wiki/Second_Bank_of_the_United_States)
1862 – Start of NY Gold Exchange; Along with stocks, gold rallied into 1869 (coincided with one of greatest bull markets in US stocks in 1860 – 1872)before Black Friday and a gold & stock crash surrounding an attempted corner on the gold market.
1902 – Stock market enters new advance following Panic of 1901 (attempt to corner Chicago rail market) – a sequence similar to what has played out in previous cycles as in 1822, following the Panic of 1819.
1942 – Stock market enters new advance following 1929 – 1942 bear market and 1937 – 1942 crash – setting one of its most significant lows in the 20th century (and the onset of one of the strongest advances).
1982 – Stock market enters new advance following 1966 – 1982 consolidation that included 1966 – 67 sell-off, 1973 – 1974 (50%) crash, 1976 – 1978 (~29%) decline, 1981 – 1982 (25%) drop – setting perhaps the most significant low in the 20th century (and the onset of the strongest overall advance).
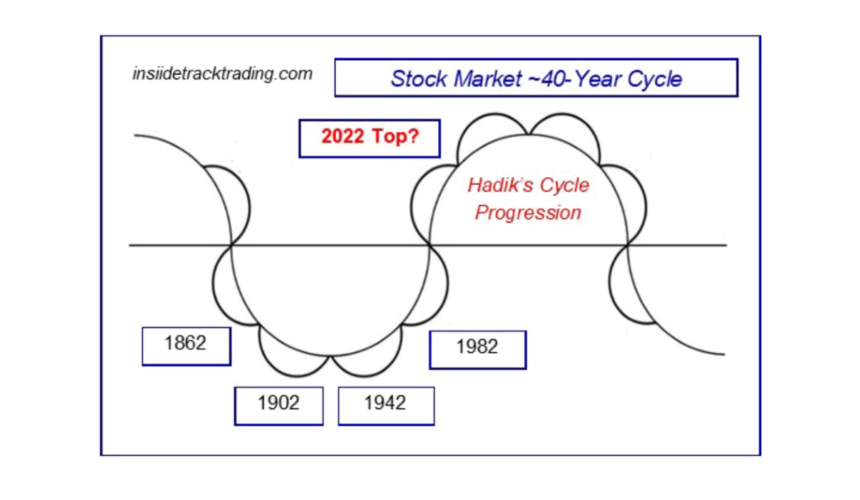
While this might normally be perceived to augur a subsequent low in 2022 and the onset of a new multi-year advance, there are key reasons why this cycle is due for an inversion and why stocks could see a multi-year peak in 2022.
First and foremost is the 40-Year Cycle Progression illustrated at the top of this page. The decisive lows in the early 1860’s, 1900’s, 1940’s & 1980’s portend a likely inversion and a peak in 2022. That would fulfill a 40-Year low (~1862) – low (1902) – low (1942) – low (1982) – (high; 2022) Cycle Progression.
Reinforcing that is the 20-Year Cycle Progression illustrated at the top of this page. The decisive lows in 1942, 1962, 1982 & 2002 portend a (similar) likely inversion and a peak in 2022. That would fulfill a 20-Year low (1942) – low (1962) – low (1982) – low (2002) – (high; 2022) Cycle Progression.
Similar to the distinctions between daily/weekly cycles – that project a stock peak for the opening days of Jan ‘22 – and monthly cycles that portend a peak in 1Q ‘22, this yearly cycle could time a separate peak that occurs [reserved for subscribers]…
All of that would dovetail closely with the 7-Year Cycle of Stock Crashes (20 – 35% or greater declines that culminated in 2016, 2009, 2002, etc.) recurring in 2023 – soon after 4Q ‘22.
Stock Indices have rallied into early-Jan ‘22 – the fulfillment of multiple daily & weekly cycles that portend an early-year peak…
It is helpful to step back and review a few longer-term factors that continue to focus on 2022 as the time when a major peak could be seen in equities. Some have just been described in the Opening Comments. Longer-term cycles peak in 2022 with the greatest synergy of related monthly cycles coming into play in [reserved for subscribers]…
Price action is another corroborating factor. A couple key indexes – the DJTA and Russell 2000 – fulfilled upside wave (price) objectives in Nov. ‘21, indicating that those highs could hold for several months (if not longer) from that point forward.
That is one of many reasons why the expected 1Q ‘22 peak has repeatedly been described as a likely divergent one with some stocks/indexes setting higher highs while others set equal or lower highs.
The Russell 2K fulfilled that wave objective and a host of decisive upside targets while peaking right at 2460/QR – its multi-year upside range-trading target…
In the same month the Russell 2000 was fulfilling that synergy of upside targets, the NQ-100 peaked right at its multi-month upside target (~16,700/NQ) and reversed lower…
Many significant stocks and indexes fulfilled 1 – 2 year upside targets in Nov ’21 – ushering in a potential topping process that was expected to stretch into 1Q ‘22 (when stronger indexes could set final highs as other indexes diverge.
1Q ‘22 (most synergistic in Jan/Feb ‘22 and ideally in Jan ‘22) is the convergence of a web of 16, 8 & 4-month cycles AND the latest phase of the most consistent cycle of this century – the 3.25-Year Cycle.
That cycle was last involved in creating the Dec. ’18 low and projecting an overall advance into 1Q ’22 – when the next phase should invert and time a peak. That would fulfill a 3.25-year low (1Q ‘09) – low (2Q ‘12) – low (3Q ‘15) – low (4Q ‘18) – high (1Q 2022) Cycle Progression.
3 – 6 month & 6 – 12 month (and even 1 – 2 year) traders and investors should have been lightening up on long positions… [refer to latest publications for current outlook and trading strategy].”
Stock Market Cycles (Including 40-Year Cycle) Collide in 2022! Early-Jan ’22 Peak Would Corroborate.
http://40yearcycle.com/uncategorized/stock-market-early-jan-22-top-danger-period-begins/
http://40yearcycle.com/uncategorized/stock-market-early-jan-22-cycle-highs-4-shadow-danger-period/